Humidity parameters explained
|
-
Michell Instruments Limited, Ely, UK
 
|
Contents
- Introduction
- Relative Humidity
- Dew-Point
- Pressure effects on humidity
- Temperature effects on humidity
- Dew point vs ppmV
|
Introduction
|
|
In order to understand humidity, it is important to understand the behaviour of gases in general. Humidity is a representation of how much water vapour is in the atmosphere, a gas, or an empty space.
The partial pressure of gases forms the basis behind all humidity measurement principles.
Dalton’s Law states that in an ideal mixture of non-reactive gases, each gas has a partial pressure which is the hypothetical pressure of that gas if it alone occupied the same volume as the mixture at the same temperature.
The total pressure of a gas mixture is the sum of the partial pressures of each individual gas in the mixture, as shown in the diagram below:

 What this means is that each gas exerts a percentage of the total pressure in proportion to the percentage of that gas in the mixture. What this means is that each gas exerts a percentage of the total pressure in proportion to the percentage of that gas in the mixture.
Water vapour is the gaseous form of water and is present in all gases. It can be thought of as a gas, and conforms to laws that govern other gases.
It has its own partial pressure (e), and every unit of humidity measurement is derived from, or directly related to, the partial pressure of water vapour.
The quantity of water which can be suspended as vapour in a volume is dependent on temperature: as the temperature of the gas increases so does the capacity to sustain water vapour.
When a gas is supporting its maximum capacity of water vapour it is said to be ‘saturated’.
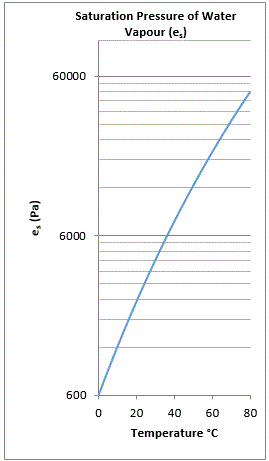
The saturation pressure of water vapour is the maximum possible water vapour pressure at a given temperature before the vapour begins to condense into liquid.
We can apply this theory using a real example of Dalton’s Law: atmospheric air. These values are nominal – especially for water vapour, which will vary greatly depending on climate.
| PNitrogen
|
=
|
78 kPa
|
| POxygen
|
=
|
21 kPa
|
| PArgon
|
=
|
1 kPa
|
| PWater
|
=
|
1 kPa
|
| PTrace
|
=
|
1 kPa
|
| PTotal
|
=
|
101.3 kPa
|
|
Relative Humidity
|
|
Relative humidity is a measurement of how close the air (or another gas) is to being fully saturated with water vapour.
More specifically relative humidity is the ratio of the partial pressure of water vapour (e), to the saturation pressure of water vapour (es), at the same temperature, expressed as a percentage:

Relative humidity is influenced by pressure variations, which change the partial pressure of water vapour e , and temperature fluctuations, which alter the saturation pressure of water vapour e s .
Therefore, for a statement of relative humidity to have validity in absolute terms then both the prevailing pressure and temperature should be given when stating %RH.
For example, the ideal conditions for comfort in an office are 55 %RH at 21 °C and 101 kPa.
Typical Applications:
• Monitoring and control of storage environments, such as warehouses or museums
• Product drying processes in pharmaceutical industry and agriculture
|
Dew-Point
|
|
The dew point is the temperature at which condensation (dew) forms when cooling a gas.
The term is often used when actually referring to frost point – the temperature at which frost forms when cooling a gas.
For example:
If a room is at a temperature of 21 °C, and the relative humidity is 55 %, then the dew point will be 11.6 °C. If it is very cold outside, and the temperature of the inside glass of a window in the room is only 3 °C, then condensation will form on the inside of the windows. This is because the glass cools the air directly next to it, causing it to drop below its dew point and become fully saturated with vapour.
|
Pressure effects on humidity
|
|
All humidity measurements are based on the measurement of the vapour pressure of water, therefore changes in the overall pressure in a mixture of gases will have an effect on the measured humidity.
In a gas mixture such as atmospheric air shown below, the total pressure P(total) of a system can be expressed as the sum of partial pressures (Dalton’s Law):
P(total) = P (nitrogen) + P (oxygen) + P (argon) +P (water) + P (trace elements)
If the total pressure (P (total)) is changed either by compression or expansion, each of the component partial pressures will change by the same factor as P (total).
Example: Effects of doubling pressure on %RH at 21 °C
|
|
|
Pressure (kPa)
|
->
|
Pressure (kPa)
|
| P (nitrogen)
|
78
|
->
|
156
|
| P (oxygen)
|
21
|
->
|
42
|
| P (argon)
|
1
|
->
|
2
|
| P (water)
|
1
|
->
|
2
|
| P (trace )
|
0.3
|
->
|
0.6
|
| P (total)
|
101.3
|
X2
|
202.6
|
| RH
|
40.31%
|
->
|
80.63%
|
As the table shows, if the partial pressure of one or more of the component gases varies then the total pressure P(total) will also vary.
|
|
If pressure is increased in a fixed system, then the dew-point will also increase proportionally, as demonstrated in the graphs below.

|
Temperature effects on humidity
|
|
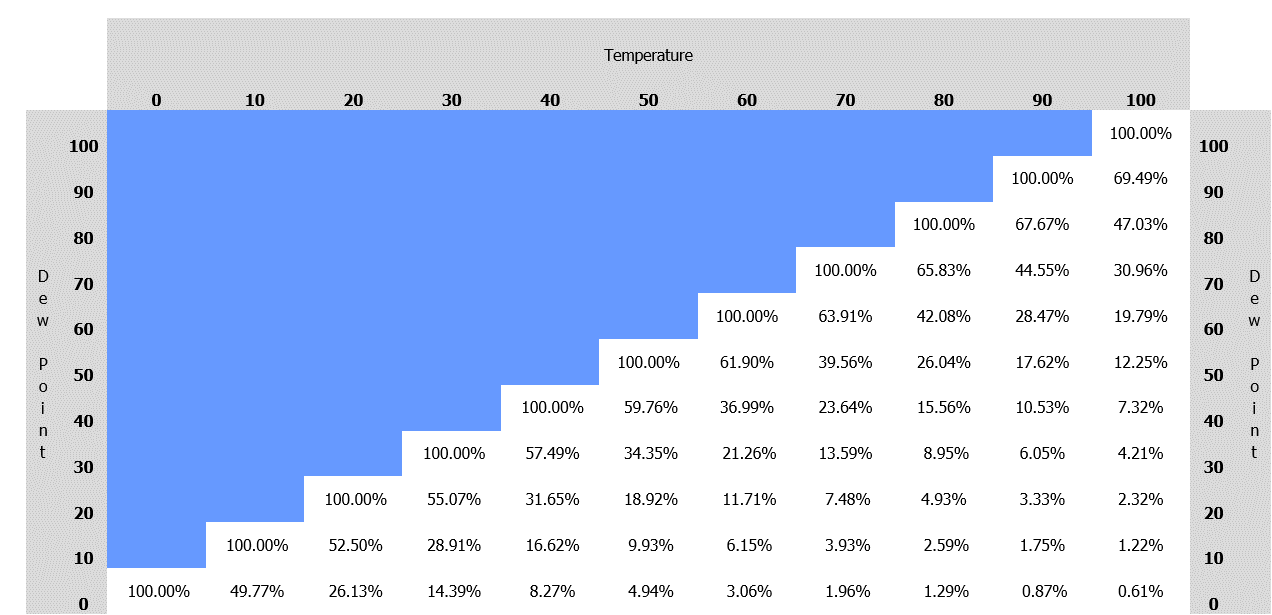
This chart shows the relationship between ambient temperature, dew point and relative humidity at a constant atmospheric pressure.
The blue section indicates that the saturation point has been reached so no further increase in the dew point temperature is possible, unless the ambient temperature of the gas is also increased to reduce the %RH.
(As we have seen above, reducing the pressure will also have the effect of reducing the %RH, and therefore raising the dew point temperature.)

Failure to take into account the effects of temperature on humidity measurement can lead to errors so large that the results are meaningless.
Often the largest source of uncertainty is the effect of temperature differences between different areas in a process, room or chamber.
Maintaining the temperature of the sampling components above the dew point is vital to avoid condensation.
Just as important is trying to keep the temperature constant, to avoid accentuating the effects of adsorption and desorption.
|
Dew point vs ppmV
|
|
Parts per million by volume can be expressed either on a dry basis or wet basis. For moisture in gases measurements the dry basis formula is almost universally used.
• Dry basis ppmV is the ratio of the volume of water to the volume of non-water components in a sample, expressed in ppmV.
• Wet basis ppmV is the ratio of the volume of water to the total volume of a sample, expressed in ppm. This is not widely used for expressing moisture in gases.
PpmV can easily be derived from water vapour pressure (e) and total pressure (Ptotal):


Understanding the relationship between ppmV and dew point gives an insight into why measuring very low levels of moisture can be tricky
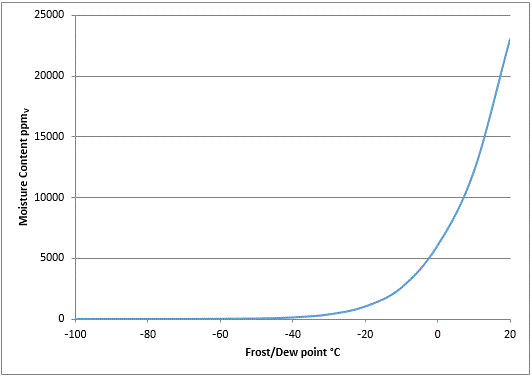
The graph below shows the relationship between parts per million by volume of moisture content and dew-point temperature (in a gas which is at a constant pressure).

The dew-point curve is exponential. At -40°C dew point and below, the line on the graph is almost flat illustrating how low the moisture content is.
Because there are so few water molecules in the gas mixture, making accurate measurements is considerably more difficult.
At these low levels, response times are slower and the sample is more sensitive to influences such as moisture ingress from low quality pipe work and fittings, incorrect material choice, dead space in the sample path and temperature variations.
|
© Michell Instruments Limited, Ely, UK — 2018
Back to top
|
|